ABAP如何在调试查看EXPORT/IMPORT 内存数据
本文共 1159 字,大约阅读时间需要 3 分钟。
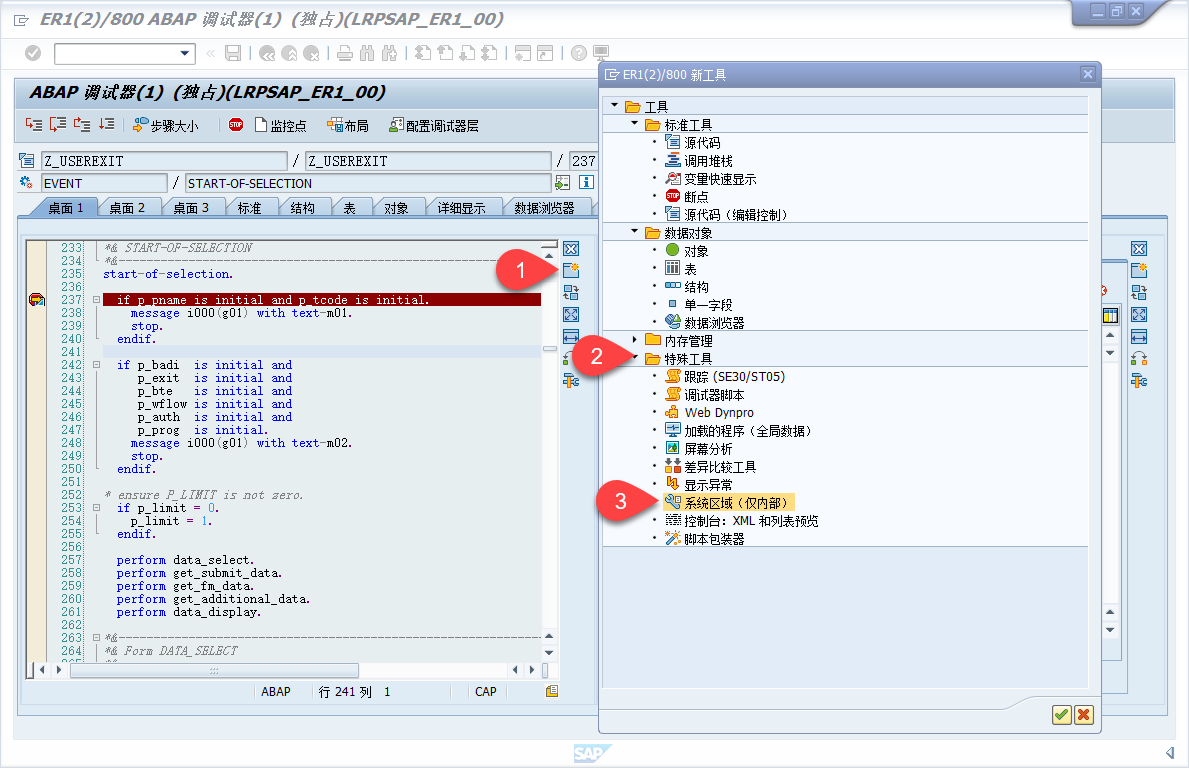
These memory IDs can be accessed in the debugger, but the option isn't accessible by default in the "new" Debugger. To display them you have two options:
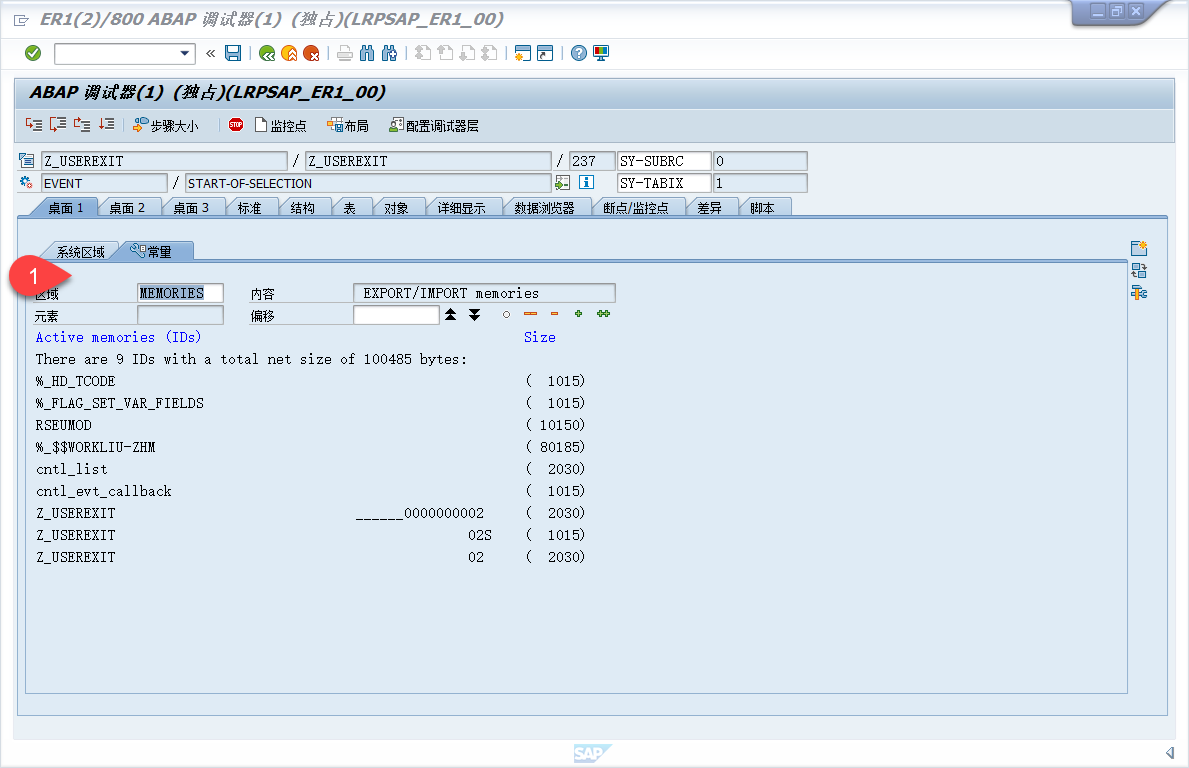
- In the new Debugger, change one of the tools you're using. Do this by clicking the "New Tool" or "Replace Tool" that you can see at the top of the vertical button column on the right of each subwindow. Open the Special Tools folder in the tree and select "System Areas (Internal Only)". In the second tab of this tool you can now see a list of areas. Double-click the MEMORIES("EXPORT/IMPORT memories") area or manually enter it in the Area input field to open the list of active memory IDs. Click through on any one to see its hexadecimal value.
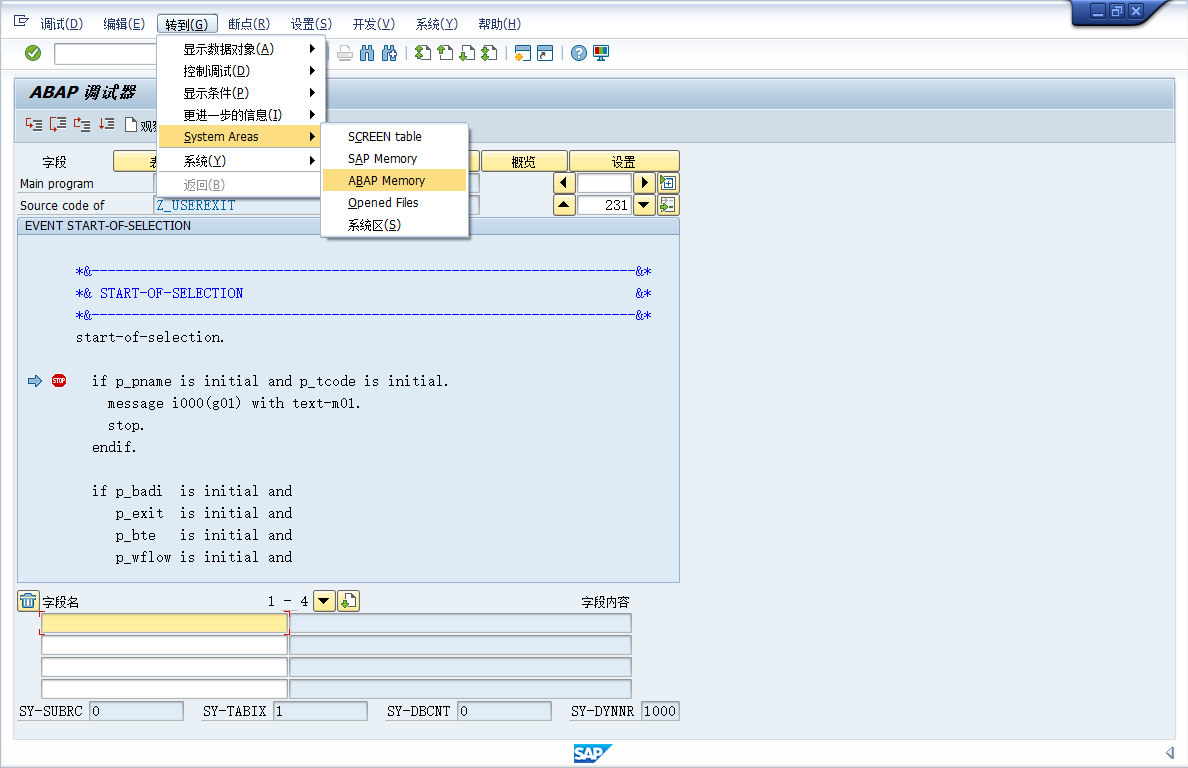
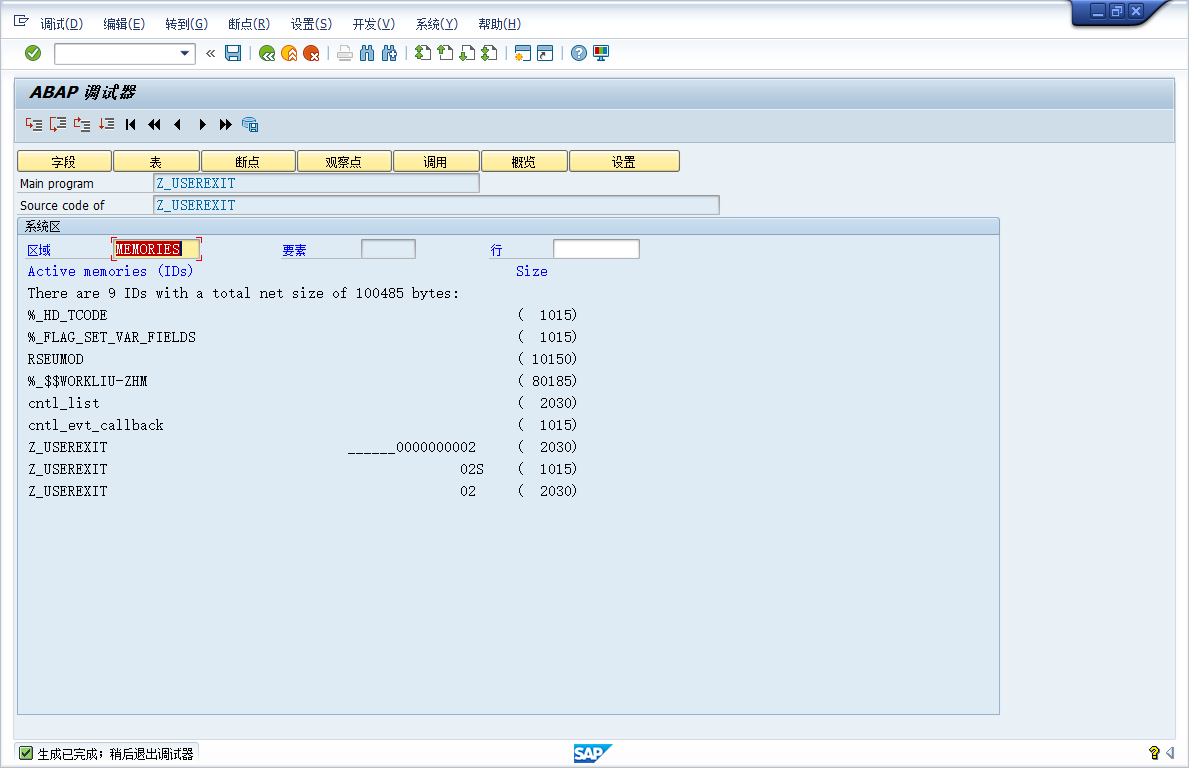
- In the menu bar, open Debugger and select "Switch to Classic Debugger". Once it opens, find the following in the menu bar: Goto, System Areas, ABAP Memory. The system areas will be displayed with the MEMORIES area selected by default.
Parameters
If you want to view the PARAMETERs that were set instead of memory IDs, the procedure is almost exactly the same. However, instead of opening the MEMORIES system area, open the SMEM ("SAP memory (SPA-GPA)") area.
你可能感兴趣的文章
leetcode 之 Single Number II
查看>>
从线程模型的角度看Netty的高性能
查看>>
[LeetCode] 20. Valid Parentheses ☆(括号匹配问题)
查看>>
【记录】【2】各种在线网址
查看>>
【Java】【22】读写properties文件
查看>>
【Spring】【1】mybatis spring的自动扫描配置
查看>>
【Java】【28】提高List的removeAll方法的效率
查看>>
【JS】【28】让输入框只能输入正整数
查看>>
【记录】【4】各种工具
查看>>
【JS】【31】读取json文件
查看>>
Ubuntu Boost 编译
查看>>
OpenCV模块分析(转)
查看>>
聊聊我对写好程序的认识
查看>>
OpenSSL源代码学习[转]
查看>>
插件原理2[转自CSDN]
查看>>
OpenCV Windows7 VC6.0安装以及HelloWorld
查看>>
python升级导致yum命令无法使用的解决办法
查看>>
vi/vim 中如何在每行行首或行尾插入指定字符串
查看>>
linux 查看端口被哪个程序占用
查看>>
socket
查看>>